
Tree Food Systems
DIGITAL WALLET
Tree Food System: The Digital Wallet that Empowers You
What if your daily shopping made you an owner, not just a consumer?
Download the Tree Food System Digital Wallet (coming soon to the Google Play Store) and join a revolutionary new market ecosystem built on the concept of “Shop to Own.”
In the traditional business model, you spend your hard-earned money, but you never own a piece of the market. You are simply funding the wealth of others.
The Cost of Business-as-Usual (Table A)
|
Service |
Daily |
Monthly |
Annually |
In 5 years |
In 20 years |
40 Years |
|
Transport |
KES 100 X 2 = KES 200 |
KES 6,000 |
||||
|
Restaurants |
KES 300 |
KES 9000 |
||||
|
Supermarkets |
– |
KES 15,000 |
||||
|
KES 30,000 |
KES 360,000 |
KES 1.8 Million |
KES 7.2 Million |
KES 14.4 Million |
Under the current system, an average household in Nairobi will spend over KES 7.2 Million in 20 years, and a staggering KES 14.4 Million over 40 years funding other people’s business. When retirement comes and people return to their rural homes, they often have no investments or passive income to show for a lifetime of spending.
The Tree Food System Advantage
We are turning your daily expenses into a powerful investment tool. Our digital platform doesn’t just share profits—it offers transparent, real-time updates on how our cooperative market system is performing.
Every single coin you spend within our ecosystem is tracked as an investment. Annually, the system calculates your cooperative dividends based on your purchasing volume, redirecting that wealth back into your pocket and into new community-owned enterprises.
How the Digital Wallet Works (Table B)
|
Monthly Shopping Capacity |
Estimated Annual Volume |
How Your Spending Builds Equity Profit made after sale sharing : |
||
|
New Investment Opportunities |
||||
|
KES 18,000 |
KES 216,000 |
• A Percentage (%) is allocated to your SHA Program • A Percentage (%) is allocated to your housing program. • A percentage (%) is available as cash withdraws
• A percentage (%) is directed into your investment portfolio. |
||
|
(e.g., Banking, Farming). |
||||
|
KES 30,000 |
KES 360,000 |
|||
|
KES 50,000 |
KES 600,000 |
|||
|
KES 100,000 |
KES 1,200,000 |
Our Growing Ecosystem
The Tree Food System digital wallet operates seamlessly across our dedicated business outlets. As we grow, our unified ecosystem will expand to serve all your daily needs, creating a self-sustaining economy of scale:
- Retail & Hospitality: Supermarkets, Restaurants, and
- Logistics & Transport: Fleet of Buses, Taxi Services, and Inter-County
- Finance & Tech: Community Banking, Digital Money, and High-Speed Wi-
- Agriculture & Production: Farming, Agro-processing, Factories, and Import/Export.
- Essential Services: Schools, Healthcare/Hospitals, and Construction/Housing.
- Energy & Lifestyle: Oil & Gas, Clothing, and Car Yard/Hire.
Stop funding others. Start investing in yourself. Shop to own with Tree Food System.
THE NEW MARKET ECOSYSTEM
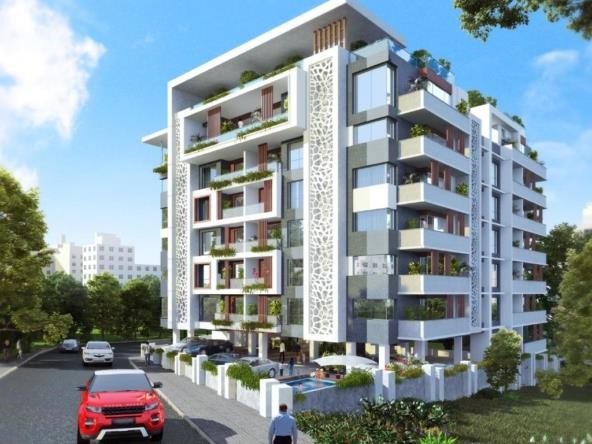
Housing
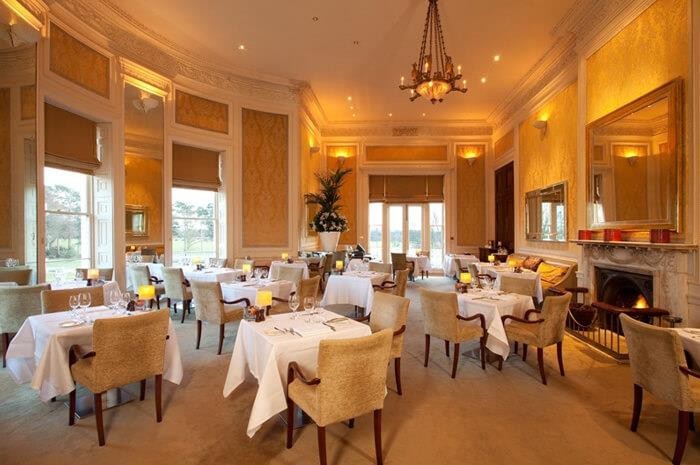
Green plate restarunt
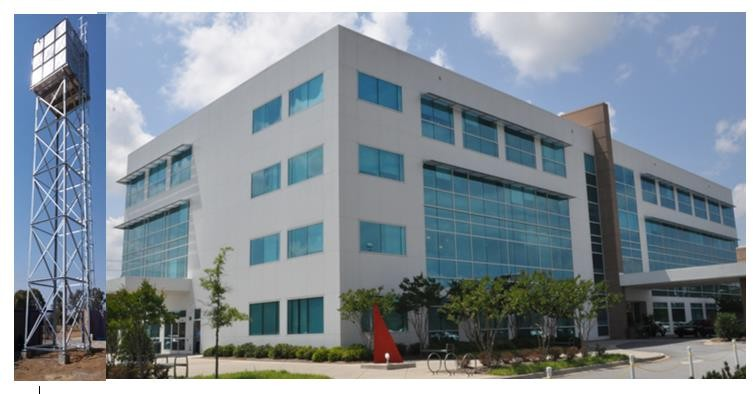
new light industries
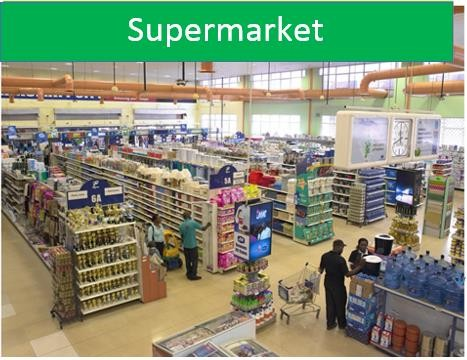
4 Rivers Mall Supermarket
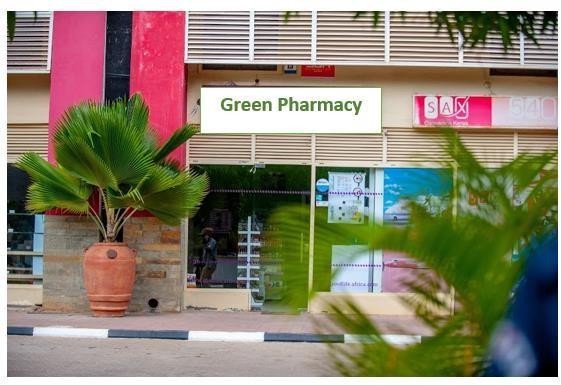
Pharmacy
21st Generation
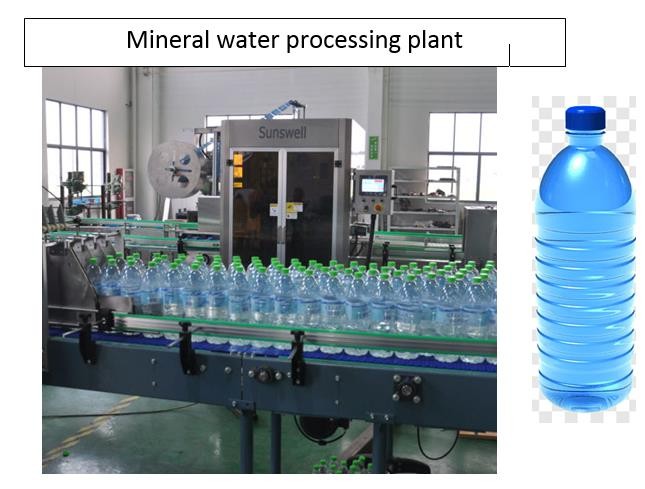
Water processing plant
Wetspring
Microfinance Bank
Load your Digital Wallet each month with the minimum amount, shop as usual, and earn while you spend
CAPITAL MOBILIZATION & DEPLOYMENT
MODEL
Restructured 5-Year Capital Mobilization Models
Model No. 1: Tree Foods Platform Digital Wallet Activation
A one-time KES 10,000 activation fee per consumer to unlock the digital wallet infrastructure, integrated directly with the customer onboarding process.
|
Year |
Annual New Shoppers On boarded |
Digital Wallet Fee (KES) |
Total Annual Fee Income (KES) |
|
1 |
100,000 |
10,000 |
1 Billion |
|
2 |
1,000,000 |
10,000 |
10 Billion |
|
3 |
2,000,000 |
10,000 |
20 Billion |
|
4 |
3,400,000 |
10,000 |
34 Billion |
|
5 |
3,500,000 |
10,000 |
35 Billion |
|
Total |
10,000,000 |
— |
KES 100 Billion |
Model No. 2: Ecosystem Monthly Retail Shopping
We model the percentage of cumulative members actively using the retail platform (Supermarkets/Restaurants) for their KES 30,000 monthly household basket.
|
Year |
Cumulative Members |
Monthly Grocery Spend per Family (KES) |
Total Funds Trapped Monthly (KES) |
Annual Retail Revenue (KES) |
|
1 |
100,000 |
30,000 |
3 Billion |
36 Billion |
|
2 |
1,000,000 |
30,000 |
30.0 Billion |
360 Billion |
|
3 |
2,000,000 |
30,000 |
60.0 Billion |
720 Billion |
|
4 |
3,400,000 |
30,000 |
102.0 Billion |
1.220 Trillion |
|
5 |
3,500,000 |
30,000 |
105.0 Billion |
1.26 Trillion |
|
10,000,000 |
3.6 Trillion |
Model No. 3: Housing Sacco Member Recruitment & Deposits
The baseline entry deposit is kept flat at KES 250,000 for the first two years during the trust-building phase, before scaling up to match premium housing developments.
|
Year |
Annual New Members Recruited |
Deposit per Member (KES) |
Annual Cash Raised (KES) |
Target Deployment Strategy |
|
1 |
100,000 |
250,000 |
25 Billion |
KES 2.5 To fund Agriculture |
|
2 |
1,000,000 |
300,000 |
300 Billion |
Supermarket chain expansion / others |
|
3 |
2,000,000 |
300,000 |
700 Billion |
Supermarket chain expansion & Phase 2 units |
|
4 |
3,400,000 |
450,000 |
1.530 Trillion |
Mass infrastructure rollout across satellite towns |
|
5 |
3,500,000 |
500,000 |
1.75 Trillion |
Pan-African market alignment & secondary assets |
|
Total |
10,000,000 |
— |
KES 4.305 Trillion |
Total Ecosystem Funding Pot |
Model No. 4: Farmer Market-Access Subscriptions
https://kenyatreefoodsystems.org/
|
Year |
Active Farmers Connected |
Annual Digital Access Fee (KES) |
Total Annual Subscription Yield (KES) |
Supply Capacity Target |
|
1 |
250,000 |
2,000 |
500 Million |
Pilot regions: |
|
2 |
1,000,000 |
2,000 |
2 Billion |
Expansion across Rift Valley & Western |
|
3 |
2,500,000 |
2,000 |
5 Billion |
Central & Eastern region integrations |
|
4 |
5,000,000 |
2,000 |
10 Billion |
Full national coverage |
|
5 |
7,000,000 |
2,000 |
14 Billion |
Complete smallholder ecosystem saturation |
Model No. 5: Ecosystem WebApp Micro-Transaction Fees
we anticipate transaction velocity to scale alongside consumer activity. Users pay KES 50 per critical digital transaction (e.g., wallet checkouts, bulk orders, delivery payments).
|
Year |
Active Shoppers |
Avg. Transactions per User / Month |
Transaction Fee (KES) |
Monthly Revenue (KES) |
Annualized Transaction Yield (KES) |
|
1 |
50,000 |
2 |
50 |
5 Million |
60 Million |
|
2 |
300,000 |
2 |
50 |
30 Million |
360 Million |
|
3 |
1,400,000 |
3 |
50 |
210 Million |
2.52 Billion |
|
4 |
4,000,000 |
3 |
50 |
600 Million |
7.20 Billion |
|
5 |
8,500,000 |
4 |
50 |
1.7 Billion |
20.40 Billion |

A New Era in Housing Shop and own your house
Monthly Shopping | Annual shopping in our market system | Total amount input in the business · The year you get the 2 bedroom house and stop rent payment | Year & amount injected through shopping | ||
In 20 years | In 40 years | ||||
KES 60,000 | KES 720,000 | KES 3,600,000 | ( 5 Years ) | KES 14.4 Million | KES 28.8 Million |
KES 50,000 | KES 600,000 | KES 3,300,000 | ( 5.5 years) | KES 12 Million | KES 24 Million |
KES 40,000 | KES 480,000 | KES 3,120,000 | (6.5 Years) | KES 9.6 Million | KES 19.2 Million |
KES 35,000 | KES 420,000 | KES 3,150,000 | (7.5 Years) | KES 8.4 Million | KES 16.8 Million |
KES 30,000 | KES 360,000 | KES 3,024,000 | (8.4 years) | KES 7.2 Million | KES 14.2 Million |
KES 20,000 | KES 240,000 | KES 3,024,000 | ( 12.6 years) | KES 4.8 Million | KES 9.6 Million |
KES 18,000 | KES 216,000 | KES 3,240,000 | ( 15 Years) | KES 4.32 Million | KES 8.64 Million |